Leonard Origins
Genetic Genealogy and Leonards
Genetic Genealogy and Leonards
DNA testing for genealogical purposes is in its early years. For non-scientists, it is difficult to understand and even more difficult to explain. Some of the difficulty with creating this new field of genetics and genealogy has to do with creating uniform systems and methodologies for laboratory testing so that there is consistency in terminology and uniform quality with results that can be compared. Some of it is in the need to build databases and classification systems so that results can be meaningfully tabulated, organized, and interpreted.
As my research continued, I found more and more clusters of Leonards whose dna and other research indicated that they were not part of James’ descendants.
There have been two types of testing that have been of early testing for genealogical purposes. One is the Y-DNA testing, which follows the male chromosome from father to son for thousands of years, skipping all daughters. This makes the Y-DNA test particularly useful in most European cultures that pass surnames down the paternal line.
Y-DNA haplotypes are clusters of results obtained by Y-DNA testing. They are used to identify the haplotype of the progenitor of a group, the first father in a string of fathers and sons. Haplogroups are identified by single nucleotide polymorphisms (SNPs), which are loci on the DNA where a nucleotide has mutated to become another nucleotide. These mutations occur rarely and slowly over time. Through the patterns of mutations, statistical estimates of how far back an individual ancestral haplotype diverged from other haplotypes and their subclades (subhaplotypes) can be calculated.
Mitochondrial DNA (mtDNA) testing is useful in tracing someone’s maternal ancestry. MtDNA is passed from a mother to all her children, but only her daughters can transmit it to the next generation. Since surnames are generally passed through the paternal line, mtDNA testing is less easy to relate to genealogical studies.
Most human DNA is not sexually oriented like the male Y-chromosome or the female X-chromosome. The rest of our DNA in our other 22 chromosomal pairs is called autosomal dna. Half of this autosomal DNA is inherited from each parent and so on back to the beginning of time. Analysis of autosomal DNA is just in its initial stages. Several services are offering to analyze your autosomal DNA to identify first through fifth cousins. As yet, they’re limited in systematic labeling and organization of data to make use of it in determining genealogically useful origins. But this, too, will come with time and further research.
In time, perhaps we will find out which, if any, characteristics (besides sex) are carried along by the Y-chromosome. The information stored on the Y-chromosome is the one piece we certainly share in common. Perhaps we will find that our intelligence, good looks, charm, and modesty are all carried by the Y-chromosome to all us Leonards!
Numbers of Y-DNA Markers Tested and What They Tell Us
Tests can be ordered for 12, 25, 37, or 67 markers. A marker is a physical location on the chromosome. Each marker is assigned a name by the scientific community (e.g., DYS 393). At each location a short DNA code repeats itself. An allele is a DNA sequence that repeats at a certain location. The number of times the sequence repeats is its value (e.g., DYS 393=12). The more the number of markers tested and compared, the greater the statistical accuracy in pinpointing how many generations back two people diverged from a common set of parents.
Matches – that is, two people having identical values for each marker – at the level of 12 markers will indicate a likelihood of a common male ancestor if both bear the same surname. In the chart at the end of this article, we see Matches at the 25, 37, or 67 marker test levels indicate a near certainty of a common male ancestor back in time. At the 25 marker level, for example, there is a 95% probability that the common ancestor was 16 generations or less back in time.
As noted above, mutations do occur, noted by a change in the value of a marker of one (e.g., a value of 11 for marker DYS 393 becomes 12). And as noted above, these mutations occur at statistically derived rates (for example, once every 500 generations, although some occur more frequently) and from those statistics, the range in the number of generations that have occurred since the mutation can be estimated.
Once a mutation has occurred, all of the descendants of that ancestor will carry that mutation, that change in value, for a particular marker. Over time, other mutations will occur in descendant lines. From those changes and the patterns they establish, a descendant tree can be drawn, and the branches of a given family can be identified.
Since mutations are occurring in different markers in different branches of a family, a distance between branches is being established that is measured by the sum of the number of marker value differences between the two family members. The table below shows the genetic results for a group who tested with FTDNA and joined the Leonard group. These are further categorized by the seriies of markers. They are clustered into “Iron Leonards” as many in the group can trace their ancestry to James Leonard of Pontypool and others in that line. A look at a table not in this book, CB Leonard and RJ Leonard have a marker value of 12 in DYS 389/2, while the other Leonards in this group have a marker value of 11 in DYS 389/2. The genetic difference is therefore 1. CB Leonard and RJ Leonard have a common ancestor, Nathaniel, seven generations back. Comparing CB Leonard and FM Leonard, one finds they differ by 1 at marker DYS 389/2 and by 1 at marker GATA H4. Their total genetic difference is therefore 2 at the 37 marker level, signifying a common ancestor. Genealogical research indicates that their most recent common ancestor was James, as they each descend from different sons of James.
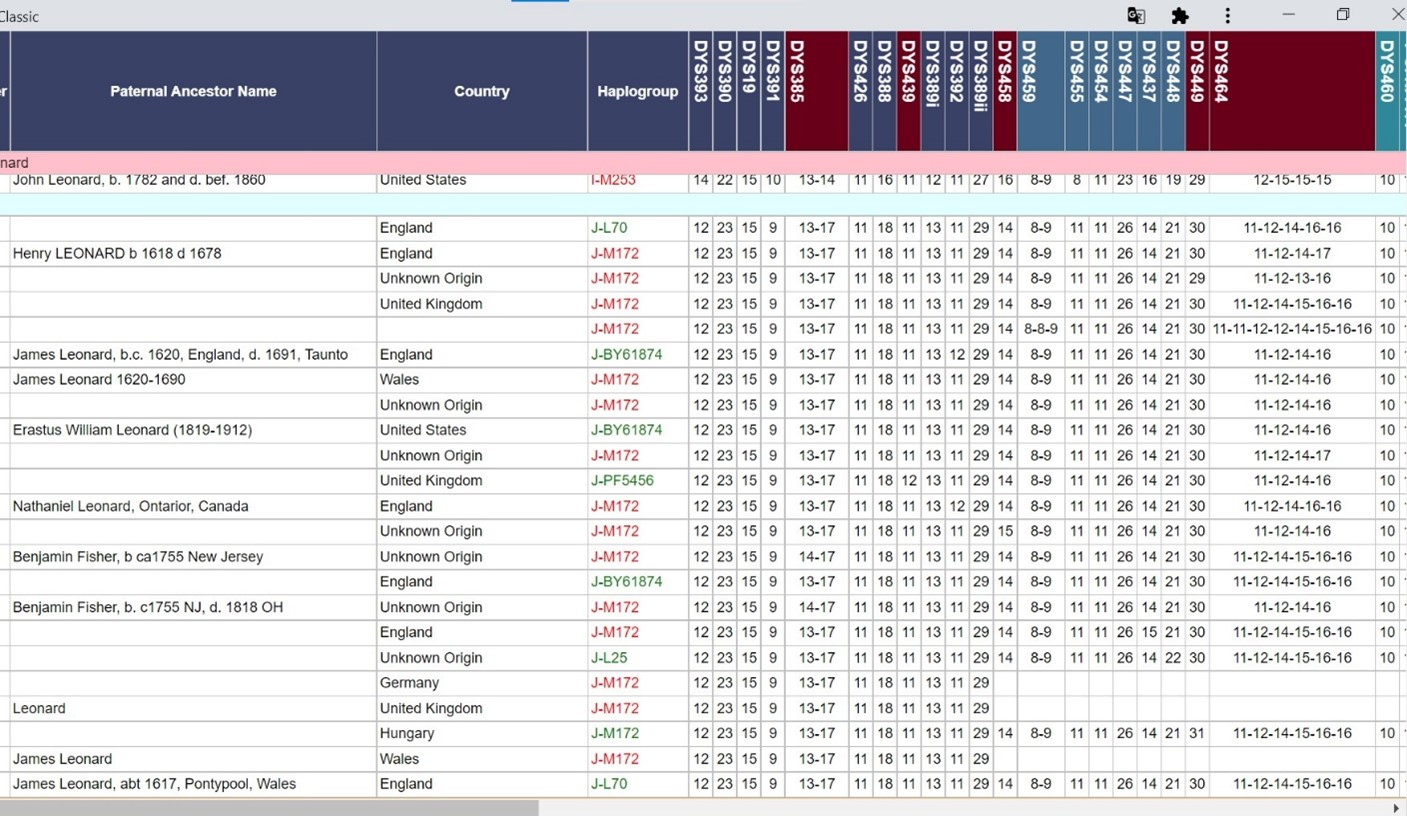
Generally speaking, a genetic difference of 1, 2, 3, or even 4 in a test of 37 markers or more indicates the likelihood of a common ancestor back in the family tree. Beyond 4, it becomes in doubt, at least for the time period where we can trace ancestry; and at 6 and beyond, it seems unlikely that there is a common ancestor since we of English ancestry began using surnames about 1100 to 1200 AD.
As an aside: a history course taken recently indicated that the Church was discouraging people from marrying if they were 1st, 2nd, 3rd, 4th, 5th, or 6th cousins in the years around 1000 AD. How people then who were known by only one name, say, Robert, could keep track of their family trees with sufficient detail to know who their 6th cousins were challenges one’s imagination!
This information is being gathered at the level of 12 markers. Further genetic testing can be done at the level of 25, 37, 43, or even 67 markers, which can be useful in narrowing down family relationships in genealogically meaningful timeframes (e.g. back to 1600, or back to when surnames became prevalent in England around 1200 AD).
A haplogroup is a term used for particular patterns of markers that identify a major population group.
“Each of us carries DNA that is a combination of genes passed from both our mother and father, giving us traits that range from eye color and height to athleticism and disease susceptibility. One exception is the Y-chromosome, which is passed directly from father to son, unchanged, from generation to generation.
“Unchanged, that is, unless a mutation occurs – a random, naturally occurring, usually harmless change. The mutation, known as a marker, acts as a beacon; it can be mapped through generations because it will be passed down from the man in whom it occurred to his sons, their sons, and every male in his family for thousands of years.
“In some instances there may be more than one mutational event that defines a particular branch on the tree. What this means is that any of these markers can be used to determine your particular haplogroup, since every individual who has one of these markers also has the others.
“When geneticists identify such a marker, they try to figure out when it first occurred (“sequencing”), and in which geographic region of the world. Each marker is essentially the beginning of a new lineage on the family tree of the human race. Tracking the lineages provides a picture of how small tribes of modern humans in Africa tens of thousands of years ago diversified and spread to populate the world.
“A haplogroup is defined by a series of markers that are shared by other men who carry the same random mutations. The markers trace the path your ancestors took as they moved out of Africa.”[1]
Haplogroups are broken down into subclades and labeled by the same process. The National Genographic Project, a five-year worldwide effort sponsored by the National Geographic Society, IBM, and the Waitt Family Foundation, is testing populations in all countries on all continents to gather data on haplogroups, their subclades, and individuals. The origins of the J haplogroup are in the Middle East, perhaps in what is now Iraq, 10,000 years ago. The mutations that formed subclade J2 occurred later, perhaps 5,000 years ago, with further mutations creating subdivisions forming subclade J2ah4 2,000 years ago around the Mediterranean in Turkey, Greece, Lebanon, and the Holy Land. This sequencing of mutations is going on in all of the haplogroups, requiring new and changing nomenclature to identify them. Indeed, one of the haplogroup R1b’s in the Leonard group has been identified as an R1b1a2a1a1a4a1a1 in the latest haplogroup tree.
There have been 160+ Leonards in FamilyTreeDNA’s Leonard surname project who have had their Y-DNA tested for at least 12 markers,[2] and some from other testing services whose results would place them in the same haplogroups as the 160.
Those 160+ sharing the Leonard surname have been distributed through testing into the E3a, E3b, I, T, J2, and R1b Haplogroups. About half, or at least 90, are in the subclade R-M269. The R haplogroup is the most common in Northern Europe, with about 120 million or more living members.
It would appear that Leonards of Irish, Welsh, English, and Scotch descent generally fall in the R1b modal haplotype, or, in the latest nomenclature, R-M269. This is a common haplotype in the British Isles and Ireland.
There aren’t enough Leonards tested in the E3a, E3b, and T haplogroups and not enough is known about their ancestry to say very much about them yet.
Twenty-four English Leonards fall into the J, more specifically, J2 haplogroup. Many of these whose genealogy has been traced back to the 1600s are descendants of James Leonard, 1620-91, of Taunton, Massachusetts, or his brother, Henry, 1618-after 1678, of New Jersey. One living in England is a descendant of an ancestor of James and Henry who never left England.
The J2 haplogroup is rather rare in the United Kingdom and Ireland. “Today, descendants of this (the J2) line appear in the highest frequencies in the Middle East, North Africa, and Ethiopia, and at a much lower frequency in Europe, where it is observed exclusively in the Mediterranean area. Approximately 20 percent of the males in southern Italy carry the marker, along with 10 percent of the men in southern Spain.”[3]
Given the relative rarity of the J2 haplogroup among the English, Welsh, Irish, Scotch, German and Scandinavian populations, this marker may be particularly helpful in identifying the common ancestry of those who trace their descendancy from James Leonard. What we have learned or can learn from genetic testing:
- Henry Leonard’s descendants should also be J2s. Henry was James’ brother. Two of Henry’s direct male descendants have been tested, and they are, indeed, J2s.
- Five of Solomon Leonard of Duxbury’s direct male descendants have been tested. They are in haplogroup I2b, subclade I-M223. This would indicate that they are not related to James and Henry Leonard.
- If direct male descendants of John and William Leonard can be found who are willing to get their Y-DNA tested, we will learn whether they have a common ancestry with James and Henry or stem from other early Leonards.
- We may be able to establish that other branches belonged to other haplogroups (e.g., R1b1) and subclades within those haplogroups easily identifiable through Y-DNA testing, thereby simplifying genealogical research. We have identified the American descendants of Robert Leonard 1745 of Scotland, for example, as well as both the American and English descendants in R1b1 of an early Samuel Leonard of Somerset, England.
- Branches of American Leonard families still residing in England or other countries of origin have been identified. Stuart Leonard of Birmingham and several of his relatives test as J2s. They must descend from a common ancestor before James and Henry.
- Contrary opinions about the ancestors of James and Henry may be resolved (whether they were effete English aristocrats or “truculent and profane” French ironworkers). This will depend upon whether we can find J2 Leonards with the same Y-DNA patterns in France or Belgium.
- Verification of genealogical research in the various branches of James Leonard’s descendants as their subpatriarchs and the characteristic patterns of their branch lines are established. For example, the CB Leonard and RJ Leonard match described earlier indicates that the same Nathaniel Leonard had families with two different wives: one in Middleborough, MA, before 1807, and one in Ontario, Canada, after 1807.
There are five instances where people with other than the Leonard surname appear in the J2 haplogroup with a pattern of markers exactly or almost exactly matching those of James Leonard’s descendants. In one case, for example, the person traces his ancestry back to a Gilbert Worden who lived in Becket, Massachusetts, in 1813. His Y-DNA pattern doesn’t match the marker pattern of other Wordens. There appear to be at least four possible answers in this situation:
- The most recent common ancestor was before the Leonards adopted the surname Leonard (which appears to have occurred in the 1400s or 1500s for James Leonard’s ancestors).
- There was a name change in the family.
- There are other families with exactly the same pattern of markers as the Leonards.
- An ancestor of the person was actually a Leonard who was adopted by a Worden or other family. Formal and informal adoptions occurred more frequently in the past when people died at a younger age.
- An ancestor of the person was actually fathered by a Leonard in an extramarital relationship.
The latter two are what DNA Heritage (http://www.dnaheritage.com/tutorial4.asp) calls “non-paternity events.” The latter occurs at about 2 to 5% every generation.
There are other Leonards who have traced their ancestry to James Leonard but find that they’re not in haplogroup J2 nor do they have a close match of markers. This is perplexing because, as yet, we haven’t figured out the cause, which could be as simple (or complex) as a mistake in tracing ancestry or as confounding as a non-paternity event. Given that the Leonards in America used the same given names and lived in the same areas, a mistake in the genealogy would be easy to make, yet hard to detect.
Here is the 12 marker pattern for Leonard J2s tested early in the FTDNA project. There are many more now.
Locus | DYS# | 15 J2 Leonard Alleles | 2 J2 Leonard Alleles |
1 | 393 | 12 | 12 |
2 | 390 | 23 | 23 |
3 | 19* | 15 | 15 |
4 | 391 | 9 | 9 |
5 | 385a | 13 | 13 |
6 | 385b | 17 | 17 |
7 | 426 | 11 | 11 |
8 | 388 | 18 | 18 |
9 | 439 | 11 | 11 |
10 | 389-1 | 13 | 13 |
11 | 392 | 11 | 12 |
12 | 389-2 | 29 | 29 |
The allele values in the first column are for Leonards who descend from James Leonard and 1 Leonard in England whose ancestry before 1750 is unknown, but whose ancestors were gunsmiths. The two Leonards in the second column trace their ancestry back to James but differ by one marker from the other Leonards. A descendant of Henry differs by one at another position not shown able: DYS458. As you look across the table on the referenced Leonard surname chart, you find a number of instances where there’s a difference of one in almost every instance. These differences will begin to identify the various branches of Leonards descending from James and Henry and their antecedents.
The Leonard surname table referenced on the Internet shows markers out to 67. There is a problem for the J2 Leonards in the so-called Palindromic Region, with markers DYS464 a, b, c, d, e, f, and g. These differences are particularly evident in markers DYS464 d, e, and f. FamilyTreeDNA was using a lab that had a different procedure for identifying these markers. They later changed to a lab with a procedure that met the newly updated standard. So those who were tested before 2007 show a slightly different pattern than those who were tested or retested later.
These tests yield results that are usually measured in the probability that someone with a given pattern of matching markers will have a “most recent common ancestor” (MRCA) with someone else in x generations. Matching 12 of 12, for example, yields a probability that the MRCA was no more than 7 generations back and a 90% probability that the MRCA was no more than 23 generations back. Testing for more markers reduces the number of generations needed to reach a 50% or 90% probability for the MCRA. For example, matching 37 of 37 markers would put the 50% probability at 4 generations back, while matching 67 of 67 would put it at 2 generations back. But mutations can occur at any time. I know of a case where brothers differ (mismatch) by 1.
Please note: These are statistical measures of probability. Based on your genealogical research, you may have identified the MRCA in 5, 10, or 15 generations back. The Y-DNA analysis supports what your genealogical research tells you (or perhaps tells you you are barking up the wrong family tree). It does not guarantee an ancestor, nor does it supply his name.
As more Leonards are tested for more markers (25, 37, 43, or 67 markers) beyond the basic 12 and can supply their genealogies back to James or before, we may be able to make some general hypotheses about what matches (e.g., 35 out of 37, 36 of 37, 37 of 37) mean in terms of the number of generations back a common ancestor may be found.
Most of us have used the FamilyTreeDNA laboratory in Houston, Texas (http://familytreedna.com). This lab offers competitive prices and services, sends their results to the National Genographic Project, and has a small discount for those in family surname projects (think “Leonard”). But there are other labs that offer comparable prices and services.
Summary on genetics
As noted earlier, Y is the male chromosome. Y-DNA is inherited from the father by the son and passed on to his sons (but not daughters), all the way back to the beginning of humanity. As mutations occur in Y-DNA, the mutations are passed on from father to son, so that over time, patterns of mutations build up and identify lines and branches of families. As humans have moved out of Africa and scattered around the earth, these patterns have developed and followed them.
Major genetic subdivisions among humans are identified in haplogroups by the patterns of genetic mutations occurring over time. These major subdivisions originated 20,000 or more years ago and are identified by letters, such as R, J, or E. Further subdivisions over time are identified by subclades in the order in which mutations occur over time in sequence. Current nomenclature applied to haplogroups identifies one’s subclade by the terminal mutation that has been tested for in one’s Y-DNA. So, for example, a haplogroup J person may be classified as a J-L70, L70 being the SNP (position and sequence of the mutation in the double helix).
We know from Y-DNA testing to date that there were a number of separate Leonard lines in England. All Leonard families do not have a common ancestor. The “iron” Leonards test in haplogroup J, also known as J2, J-L70, or, further down the sequence, J-PF5456 to the terminal SNP mutation identified to date. Solomon Leonard’s descendants are in haplogroup I or I2b, while most of the Irish and many of the English Leonards test in haplogroup R, also known as R1b or R-M269, the most common haplogroup in the British Isles.
Over one-half of the 160+ Leonards who have been genetically tested fall into the R1b haplogroup, far and away the most frequent haplogroup of people in the United Kingdom.
Roughly 20% of the Leonards fall into the “iron” Leonard line, testing in the J2 haplogroup. We do have a common ancestor or perhaps better described as a string of common ancestors, from whom we diverged at some point, probably less than 2,000 years ago (but remember, surnames go back only to the year 1250 AD or so).
As an example of how far back haplogroup J2s go, three skeletal remains testing as J2s were recently found at a Merovingian buriel site (Roman-Frankish transition period – 4th to 6th Century AD) in Borgharen in the Dutch province of Limburg. The burial site was on top of that of a Roman villa and was used until the Karolingian period by the locals. So it’s possible the Leonards and their ancestors have been in that area a long time.[4]
There can be problems using Y-DNA to identify family relationships. Roughly 1 to 2% of people born in each generation are the result of non-marital relationships, muddying the Y-DNA identification of descendants. Also, with mortality rates high, many children were orphaned, formally or informally adopted, and took on the surnames of the family that adopted them. Hence, there are men being tested whose results show their father’s father’s father’s and so on… to have been an “iron” Leonard, but they carry a different surname.
Within the testing for haplogroups and their subclades, there is a second Y-DNA test applied that examines for Y-STR’s, or Y Single Tandem Repeats. These patterns mutate as well, but more often than SNP’s and in different patterns by family branch. By analyzing the Y-STR patterns, the genetic genealogist can measure how closely related the branches of the same genetic family are and sometimes which branch of the family the individual belongs in.
Chromosome Y-DNA analysis does not replace genealogical research, but can be a helpful tool useful in conjunction with genealogical information to verify family and branch lines.
A further genetic genealogical tool, analysis of the mutation patterns embedded in the other 22 chromosomes, autosomal dna, is rapidly being developed and identifies mutation patterns associated with particular ancestors back as far as 10 or more generations. And it is not limited to a particular surname. How accurate this may be in identifying, verifying, and placing ancestors remains to be seen. In my case, it has been quite accurate back as far as third cousins and may be accurate further back. The problem is that I have hundreds of fourth cousins, and it can be very time-consuming to reconstruct relationships to any particular 4th (or more remote) cousin. In one instance, we identified a distant 12th cousin by reducing the segment size of matching centimorgans to 3 cm, but there remain questions as to accuracy at this level.
We’re in the midst of a revolution in genealogical genetic technology. Y-DNA provides us with the means to better explore and document the direct male “deep” ancestor of our lines. The Y-DNA is transferred from father to son over thousands of years with some intermittent mutations that can help tease out individual lines within the larger line. The possibilities of autosomal dna are just beginning to show themselves. However, they will affect all genders as well as RNA and potentially provide answers where we yet don’t know how to phase these questions.
[1] National Geographic web site – National Genographic Project – for more information, see http://www.nationalgeographic3.com/genographic/.
[2] See http://www.worldfamilies.net/surnames/leonard/results.html for a full listing.
[3] National Genographic Project
[4][4] Merovingers in een villa; Romeinse villa en Merovingisch grafveld Borgharen – Pasesstraat. http://j2m172.info/2015/04/three-j2-found-at-merovingian-buriel-site-roman-frankish-transition-period/. Haplogroup J2 is relatively rare among Dutch men, carried by 2.7% of them.